Home
Courses
Problem Solving
Code
Python Matplotlib Module for Data Visualisation
In this course, I will show how to use the python Matplotlib module for Data Visualisation.
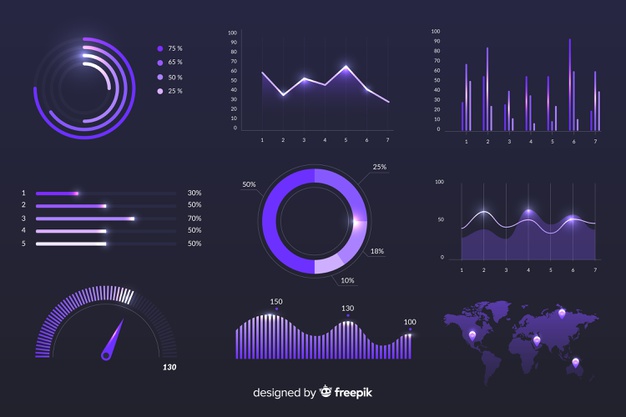
Course Curriculum
Line Chart
1
Plotting Line Chart - Python Mathplotlib Module
2
Update title and labels of the plot - Python Mathplotlib Module
3
Plotting Multiple Line Chart and and legend - Pyplot of Mathplotlib
Bar charts and Histograms
4
Plotting Bar Charts - Pyplot of Mathplotlib module
5
Plotting Multiple Bar Chart together - Pyplot of Mathplotlib
6
Updating color of bar chart - Pyplot of Mathplotlib Module
7
Mathplotlib pyplot histogram chart
8
Bar chart vs histogram
Scatter Plots
9
Creating scatter plot - Python Mathplotlib Module
10
Update scatter plot marker size and color - Python Mathplotib Module
11
Update scatter plot marker style - Python Mathplot Module
Stack plots
12
Creating stack plot - Python Mathplotlib Module
13
Add legend and legend color to stack plot - Python Mathplotlib Module
Pie Charts
14
Creating Pie Chart using pyplot of Python Matplotlib Module
15
Setting color of Pie chart - pyplot python mathplotlib module
16
Setting Starting Angle of pie chart using pyplot of python mathplotlib module
17
Adding Shadow to Pie Chart using pyplot of python mathplotlib module
18
Exploding Pie Chart using pyplot of python mathplotlib module
19
Adding percentage to pie chart Mathplotlib
Copyrights © 2023 All Reserved by
Art of CSE
About
Contact